Many homeowners expect solar to erase their electric bill. Then a statement arrives with a $146 balance, demand charges, and confusing credits. The question becomes: why is my solar bill still high?
The answer usually involves several small leaks, not one broken panel. Your utility may still charge connection fees, minimum bills, taxes, or time-of-use premiums. Net-metering rules can also value exported electricity below your evening purchase rate. The U.S. Energy Information Administration reported an average residential electricity price of 16.48 cents per kilowatt-hour in 2023. Rates have continued rising in many markets. That change can reduce expected savings, even when your system performs normally.
Solar analyst Paula Mints has warned, “A solar system does not eliminate every charge on an electric bill.” That practical observation matters. The National Renewable Energy Laboratory explains that production depends on orientation, shading, weather, and system losses. A dusty panel beside a chimney may produce less than its sales estimate. A new heat pump, electric vehicle, or poorly timed water heater can quietly consume every extra kilowatt-hour.
Berkeley Lab’s Tracking the Sun report also shows that installed prices and system designs vary widely across households. Comparing your bill requires more than checking total kilowatt-hours. Inspect each line, compare solar production with inverter data, and review your utility’s export rate. Small details matter.
Sometimes, the system is fine.
Sometimes, the estimate was too optimistic. This guide examines both possibilities and identifies practical fixes before expensive upgrades become your first response.
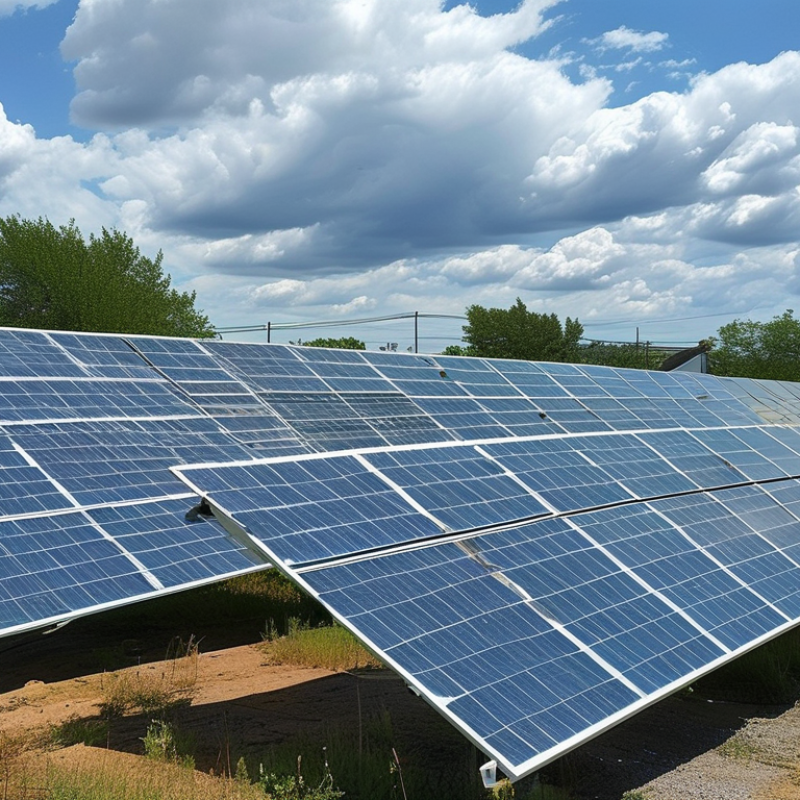
A solar home can still receive a high electric bill, even when panels produce power daily. Solar panels reduce grid purchases, but they rarely remove every utility charge. Many bills include fixed service fees, delivery costs, taxes, and seasonal adjustments. These charges remain after solar generation.
Household energy use may also exceed solar production. Air conditioning, electric heating, water heaters, and charging equipment can consume power after sunset. Winter brings shorter days and weaker sunlight. Dust, shading, wiring faults, or aging equipment can reduce output further. Check your monitoring data against the utility meter. A mismatch deserves professional inspection. Do not assume the panels are failing.
Tips: Read each billing line carefully. Compare daytime production with evening consumption. Inspect panels after storms, but avoid climbing onto the roof. Ask a qualified solar technician to test system output, inverter alerts, and meter readings. Review your utility’s current rate plan, because export credits may have changed. A battery can improve energy timing, but it may not lower every charge. It is not always the answer.
One overlooked issue is behavior. Running laundry, pool pumps, or heating systems during expensive evening hours can raise costs quickly. Smart controls may help shift flexible loads into sunny periods. Still, savings depend on local rates, weather, and actual household habits.
A careful bill review often reveals smaller problems first. That can be frustrating. But it is useful.
How to Fix Why Is My Solar Bill Still High in 2026?
Checking Solar Production, Energy Usage, and Utility Meter Data
A high solar bill does not always mean the panels are failing. Check production in kilowatt-hours, not only the app’s dollar estimate. Compare the current month with the same month last year. Cloudy weather, shading, dust, or a tripped inverter can reduce output. A simple inspection may reveal leaves covering one section of the array. However, do not climb onto the roof without proper training.
Your home may also be using more electricity than expected. Heating, cooling, water heating, and electric vehicles can quickly consume solar energy. Read the meter at a similar time each day for several days. Then compare household usage, solar production, imported energy, and exported energy. The utility bill should show matching dates. It may not. Billing periods and solar monitoring periods often differ, which can create confusing comparisons. I have seen homeowners blame production when their air conditioner was the larger issue.
Tips: Record meter readings weekly. Photograph the display when the billing period ends. Check whether the meter records both imported and exported energy. Ask the utility for interval data if available. If production seems unusually low, contact a qualified solar professional and request system test results. An electrician can also inspect unusual household loads. Keep every bill and reading. Small gaps in records can lead to wrong assumptions.
| Month | Solar Production (kWh) |
Home Energy Use (kWh) |
Solar Used at Home (kWh) |
Energy Exported (kWh) |
Grid Import (kWh) |
Utility Billed Energy (kWh) |
Average Energy Rate (USD/kWh) |
Fixed Charges (USD) |
Estimated Bill (USD) |
Primary Bill Driver | Data Check |
|---|---|---|---|---|---|---|---|---|---|---|---|
| January | 620 | 980 | 520 | 100 | 460 | 460 | $0.18 | $18.00 | $100.80 | High winter usage | Matches |
| February | 710 | 900 | 590 | 120 | 310 | 310 | $0.18 | $18.00 | $73.80 | Heating and evening loads | Matches |
| March | 920 | 860 | 680 | 240 | 180 | 180 | $0.18 | $18.00 | $50.40 | Remaining grid imports | Matches |
| April | 1,080 | 820 | 700 | 380 | 120 | 120 | $0.19 | $18.00 | $40.80 | Fixed charge is significant | Matches |
| May | 1,210 | 850 | 720 | 490 | 130 | 130 | $0.19 | $18.00 | $42.70 | Exported energy may not offset imports equally | Matches |
| June | 1,260 | 930 | 760 | 500 | 170 | 170 | $0.20 | $18.00 | $52.00 | Higher rate and evening demand | Matches |
| Six-Month Total | 5,800 | 5,340 | 3,970 | 1,830 | 1,370 | 1,370 | $0.18 Average | $108.00 | $360.50 | Usage timing and fixed charges | Reconciled |
How to Fix Why Is My Solar Bill Still High in 2026?
Solar panels can reduce energy costs, yet a high bill may still appear. The cause is often the billing structure, not faulty equipment. Review one full bill, including usage, credits, fees, and taxes. A sunny month can still produce a disappointing result if your household uses power after sunset.
Net metering rules may have changed. Some utilities now credit exported electricity at a lower rate than household consumption. Others apply time-of-use pricing, making evening electricity more expensive. Fixed utility charges also remain, even when your panels cover nearly all annual usage. These charges may include grid access, delivery, minimum service, or public program fees. Rate changes can quietly increase the bill before you notice them. I have found that many homeowners compare only kilowatt-hours, which is an incomplete check. The price per kilowatt-hour matters just as much.
Tips: Compare your last twelve bills. Mark solar production, grid imports, exports, and peak-hour usage. Check the net-metering section for credit expiration dates. Ask the utility for its current rate sheet, not an older estimate. Inspect the meter for unusual nighttime consumption, such as water heating or pool equipment. Keep records.
A professional review can reveal whether battery storage, load shifting, or panel maintenance would help. However, savings depend on local rules and household habits. Do not assume more equipment guarantees lower costs. Sometimes, my first interpretation of a bill is wrong. Careful comparison is essential.
Rising electricity rates can increase the value of exported solar energy while also raising the cost of electricity imported from the grid. Net-metering rules, fixed utility charges, taxes, and time-of-use rates can therefore keep a solar bill higher than expected.
The chart shows the average U.S. residential retail electricity price in cents per kilowatt-hour. Even when solar reduces annual energy purchases, a household may still pay fixed grid-access charges, non-bypassable fees, taxes, and higher post-solar rates caused by utility tariff changes. Review your net-metering credit rate, export limits, time-of-use schedule, and fixed monthly charge to identify the remaining cost.
Data source: U.S. residential average retail electricity prices reported by the U.S. Energy Information Administration, 2020–2024.
A high solar bill often begins with reduced panel performance, not higher electricity use. Dust, pollen, bird droppings, and nearby tree shade can block sunlight. Even a narrow shadow across one panel may lower the output of an entire string. Check your monitoring history for sudden drops, especially after storms or maintenance work. Inverter warnings, repeated shutdowns, or unusual heat around electrical equipment require inspection by a qualified professional. Do not open energized equipment yourself.
A weak connection, damaged cable, or failing inverter can silently reduce production for weeks. Compare your current daily output with the system’s records from the same season. Weather matters, but a persistent decline needs evidence-based testing. Your utility meter may also be misconfigured, or export credits may have changed in 2026. Review the latest bill beside your solar monitoring data. The numbers may disagree. That disagreement is useful.
Tips: Clean panels only when safe and permitted. Keep trees trimmed outside the array’s morning and afternoon sunlight. Photograph error messages before resetting anything. Ask for voltage, insulation, and inverter tests in the service report. I would not assume the panels are defective too quickly; poor shade analysis is a common oversight. Also check battery settings, because emergency-reserve limits can increase grid purchases. Small details matter.
Solar panels can produce plenty of electricity while your bill remains surprisingly high. The problem often involves timing, not generation. Many households export power during sunny afternoons, then buy electricity during expensive evening hours. Review your hourly usage data and compare it with your system’s production records.
Shift flexible appliances into daylight hours. Run washing machines, dishwashers, water heaters, and pool pumps when solar output is strongest. A simple timer can help. Keep evening consumption visible. A five-minute daily check may reveal an unnoticed heater, charger, or cooling system.
Battery settings also deserve attention. Reserve levels that are too high can prevent useful discharge before midnight. However, aggressive discharge may leave insufficient backup during outages. Local electricity rates, weather, and household routines all matter. There is no universal setting. Ask a qualified installer or electrician to inspect wiring, inverter performance, and meter readings if the numbers disagree.
Do not ignore efficiency. Seal drafty doors, clean filters, and adjust cooling temperatures gradually. Replacing an old appliance may reduce demand more than adding panels. This is where many plans become expensive. Bigger equipment is not always smarter.
Track changes for four weeks, then compare total grid purchases, not just solar production. Your first adjustment may fail. That is useful evidence. Refine one habit at a time, and keep written records of bill charges, export credits, and unusual weather.
: Solar panels reduce grid purchases, but they rarely remove every charge. Fixed fees, delivery costs, taxes, and service charges may remain. The bill can still look surprisingly high.
Yes. Air conditioning, electric heating, water heaters, and charging equipment can consume large amounts. Evening usage matters most when solar production has stopped. Winter sunlight may also be weaker.
Compare monitoring data with your utility meter. Review production, grid imports, exports, and nighttime usage. A mismatch may require professional inspection. Do not assume the panels are failing.
Yes. Exported electricity may receive lower credits than imported electricity costs. Time-of-use pricing can make evening power especially expensive. Check the current rate sheet and credit rules.
Fixed charges may include grid access, delivery, minimum service, and public program fees. Taxes can remain too. Solar generation does not always cancel these costs.
Run laundry, dishwashers, water heaters, and pool pumps during sunny hours. Simple timers can shift flexible loads into daylight. This may reduce expensive evening purchases.
No. A battery can shift solar power into evening hours, but savings depend on local rates. Poor settings may limit useful discharge. A battery is not always the answer.
Check filters, drafty doors, appliance age, inverter alerts, wiring, and meter readings. An old appliance may waste more power than expected. Bigger equipment is not always smarter.
Track bills, grid purchases, solar production, credits, and weather for four weeks. Change one habit at a time. Your first adjustment may fail. That is useful evidence.
Contact a qualified technician when monitoring data and meter readings disagree. Ask for output, inverter, wiring, and meter tests. Avoid climbing onto the roof. Safety matters.
If you are wondering, “why is my solar bill still high,” the answer may involve more than solar panel production. A home can still receive a large electricity bill when household energy use exceeds solar generation, especially during evenings, seasonal changes, or periods of high demand. Start by comparing your system’s production records with your home’s usage data and utility meter readings. This can reveal whether the issue comes from increased consumption, inaccurate readings, or lower-than-expected solar output.
Your bill may also include fixed utility charges, changing electricity rates, time-based pricing, or net metering rules that limit the value of excess energy sent to the grid. If production is unusually low, inspect the system for shading, dirt, equipment faults, wiring issues, or monitoring errors. To reduce future costs, shift flexible activities to sunny hours, improve efficiency with smart controls, reduce standby consumption, and track monthly performance. Regular reviews of energy use and system data can help identify problems early and make solar savings more consistent.

Jonas Energy